Adding/Editing a Column Report Template
When you add or edit a Column report template, the Edit Report window appears:
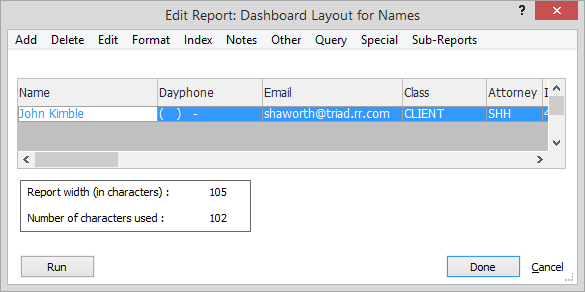
Design the report and then click Done to save your changes. To see a preview of the report, click Run.
Do any of the following to use the Edit Report window to configure the report template:
Add columns to the report
-
Click Add. The Fields window appears.
-
Check the fields you want to appear in the report. Each checked field will appear as a column in the report.
-
To edit a field, highlight the field and click Edit. The Enter a Value window appears. Edit the field name as desired and click Done. The Enter a Value window appears again. This time, edit the field description and click Done.
-
Click Done.
Delete columns from the report
Click within the column and click Delete. A window appears asking you if you are sure you want to delete the column. Click Yes.
Edit columns in the report
NOTE: Do not change the Expressions and Only Print on Group Break # options unless you are an expert.
-
Double-click the header of the column you want to edit OR click within the column and click Edit. The Column Properties window appears.
-
Complete the settings on the window. Click here for help understanding the settings.
-
Click Done.
Change page layout
-
Select Format > Page layout. The Page Layout window appears.
-
Complete the settings on the window. Click here for help understanding the settings.
-
Click Done.
Create a custom page header
Normally, the default page headers are all a report needs. But, if you need other information to appear in the report header, you can create a custom page header.
-
Select Format > Custom headers. The Page Headers window appears.
-
Complete the settings on the window. Click here for help understanding the settings.
-
Click Done.
Change font usage
-
Select Format > Fonts. The Report Font Setup window appears.
-
Complete the settings on the window. Click here for help understanding the settings.
-
Click Done.
Add images to the first or all pages
-
Select Format > Images. The Report Images window appears.
-
Change the settings on the window. Click here for definitions of settings.
-
Click Done to save your changes.
Sort the report
-
Click Index. The Edit Index Properties window appears.
-
Complete the settings on the window. Click here for help understanding the settings.
-
Click Done.
Change notes display in the report
For Name and matter reports only. Notes can contain a special marker of three asterisks (***). When notes are being displayed on screen or on a report, you have the option of printing all notes, no notes, or only text up to the "***" (referred to as "partial" notes).
-
Click Notes. The Notes Display window appears.
-
Complete the settings on the window. Click here for help understanding the settings.
-
Click Done.
-
If you selected No, then you are finished with this procedure. But if you selected Yes or Partial, then the Enter a Value window. Enter the number of characters you want to use to indent notes. If notes are printed, they appear under the main record and can stretch all the way across a page. Indenting the notes lets you center the notes and position them for the best appearance. Click Done.
-
Another Enter a Value window appears. Enter the number of characters wide you want the notes column in the report to be. Click Done.
-
Another Enter a Value window appears. Enter the number of notes you want to print. If you enter 0, all the notes will print. Any other integer value will print the latest number of notes. For example, if you have clients with hundreds of notes, you may prefer to only print the latest 10 notes for each. Click Done.
Change the example record
-
Select Other > Data. A Browse window appears.
-
Highlight the record you want to use as an example as you design the report template.
-
Click Select.
Define report groups
After an index is selected, you can define groups that group together records with common data. For example, a Names report might have a group of all last names that start with the same letter.
To have a report group, you must be using an index. A group expression must then match the first part of the index expression. All records in the first group will have the same value for the group expression.
CHANGE For instance, if you index Names by LastName + FirstName, you can create a group expression for LEFT(LAST, 1). Notice the LEFT() function is used to specify the first character of the last name. All names that start with "A" are now in a group. When you hit the Name that starts with a "B", this is called a group break. At this point a report might output special footers or totals or even a page break.
Once the footer information for the "A"s is done, a report may print group header information for the upcoming "B"s, then print the "B"s as a group, and so on with footer information following each group.
-
Select Other > Groups. The Group Properties window appears.
-
Complete the settings on the window. Click here for help understanding the settings.
-
Click Done.
Changing the report name
-
Select Other > Rename.
-
The Modify report name window appears. Change the name and description for the report template as necessary and click Done.
Assign a query to the report
-
Click Query. The Queries window appears. Click here for more information about managing queries
-
Under Show, select the type of query you want to see.
-
Highlight the query you want to assign from the list.
-
Click Done.
Creating a synopsis report
Synopsis is a special report format that lists all the linked data (events, notes, etc.) in one list chronologically. To create a synopsis report, click Special and then click the synopsis report you want.
Creating sub-reports
In Name and Matter reports, you can list linked data for each master record. For example, a name block report can list the related matters for each name. It can also list the linked Events!
You can control how these lists are formatted:
-
Select Sub-Reports.
-
Select the database to link.
-
The Sub-Report window appears listing columnar reports for that database appears. Complete the settings on the window. Click here for help understanding the settings.
-
Click Clear if you do not want a sub-report for this database to appear. To make changes to the fields displayed in the sub-report, finish editing your main report, then edit the selected sub-report itself (probably "Linked List in..."). For example, to add a different field to the list of linked Events printed in a Matters report:
-
Select File > Reports > Events.
-
Click Reports.
-
Highlight Link List in Other Reports.
-
Click Edit.
-
Modify the report as desired.
-
Notice that you can also assign a query to this sub-report to limit the linked records printed! If you don't want DONE Events listed, just assign the NOT_DONE query to this report.
Linked names and matters are always sorted in the order set at the respective Name or Matter window. For example, at the Name window's Linked Matters tab, click one of the sortable column headers to sort the list as desired. This is memorized as your preferred sort order for linked matters, and any reports listing linked matters will use that setting.
The sort order of linked events is always by date.