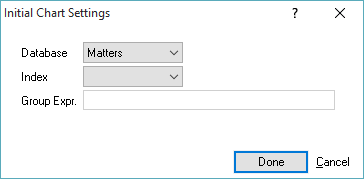
When you select to add the Chart Creator app to the Dashboard, the Initial Chart Settings window appears.

Change the settings in the window and click Done to save.
Database: Select the database for the type of records you want the chart to use.
Index: Select how you want the data to be sorted or grouped.
Group Expr.: Enter an expression to define how records will be grouped to be counted. Usually, Group Expr. will be the same grouping as Index.
The chart appears on the Dashboard.
Click here for more information about editing settings for the app.