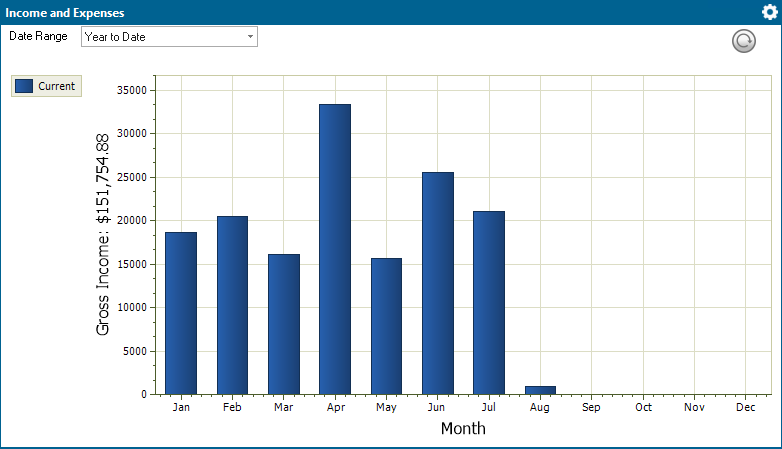
The Income and Expenses app on the Dashboard shows the income and expenses for your firm for the selected date range. Use the Date Range setting to select a time span for the chart. This app is only applicable when you have Abacus Accounting installed.

To edit settings for the app:
Click the app’s
Settings button and click
Settings. The Income/Expense
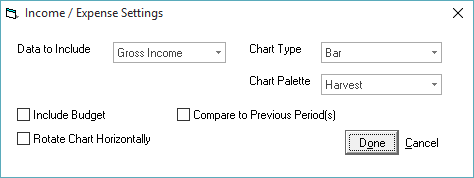
Settings window appears.

For Data to Include, select the data to include in the chart.
For Chart Type, select the type of chart you want to see.
For Chart Palette, select the color scheme you want to use for the chart.
Check Include Budget if you want to include comparable budget data in the chart.
Check Rotate Chart Horizontally if you want to flip the chart's axes (so that Month becomes the y-axis).
Check Compare to Previous Period(s) if you want to include comparable historical data for the previous period.
Click Done to save your changes and close the window.