Editing Settings for Charts
-
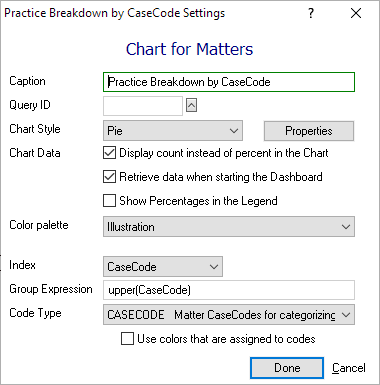
On the Dashboard, click the chart app’s Settings button. The Chart Settings window appears.
-
For Caption, enter the title to appear in the app's title bar.
-
If you want to use a query to filter the records that appear in the chart, click the Query ID look up button. The Query Manager appears. Highlight a query and click Done. If you need more help with this window, click the help button on the window or press F1.
-
For Chart Style, select the type of chart you want to use.
-
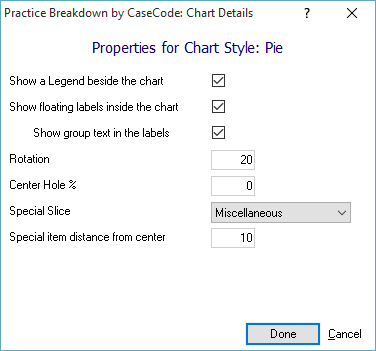
To change the properties of the chart, click Properties. The Chart Details window appears. Make changes as necessary and click Done.
-
For Chart Data, check the options you want to apply to the chart data.
-
Check Display count instead of percent in the Chart if you want to see the data broken down by number of records instead of percentage of records.
-
Check Retrieve data when starting the Dashboard if you want the data to refresh each time the Dashboard opens.
-
Check Show Percentages in the Legend if you want to see total percentages next to each legend category.
-
-
For Color Palette, select the color palette to use for the chart.
-
For Index, select how you want the data to be sorted or grouped. For example, you might want to sort matters by attorney or casecode.
-
For Group Expression, enter an expression to define how records will be grouped to be counted. Usually, Group Expression will be the same grouping as Index. For example, if you want a count of matters by attorney, you would select to index by attorney and then, also, to group the count by attorney to count the cases every unique attorney has.
-
Set Code Type to the code related to the selected index. This will map a description to records. For example, if you selected to index by Attorney, set Code Type to Who. That way the chart will be able to label records with descriptions (for example, NB is Neil Barnes).
-
Casecodes can be assigned colors. if you have selected casecodes for the chart and if you want to use those same colors in the chart, check Use colors that are assigned to codes.
-
Click Done to save your changes and close the window.